OncoScape
OncoScape is a package for cancer gene prioritization for the R statistical programming environment. It compares molecular profiling data of two groups of samples in order to identify genes that show significant differences between these groups. Currently, OncoScape performs an analysis of the five data types: (A) Gene Expression (B) DNA Copy Number (C) DNA Methylation (D) Mutation (E) shRNA knock-down data.
Aberrations in each gene are called for each data type separately and scored as 0 (no significant difference found) or 1 (significant difference found). These scores are summed across all data types giving the final score. OncoScape differentiates between activating (oncogene-like) and inactivating (tumor suppressor-like) aberrations and calculates independent scores for both directions, the oncogene score and tumor suppressor score, respectively. Furthermore, a combined score is calculated as oncogene score minus tumor suppressor score. OncoScape can be applied to the comparison of any arbitrary groups of samples, such as: (A) Tumors vs. Normals (B) Cell-lines vs. Normals (C) Samples sensitive to treatment vs. resistant ones (D) Samples with mutations in gene X vs. wild type ones (E) Diferent cancer subtypes.
This web page provides access to the results of our comprehensive analysis of tumor samples from 11 cancer types and cell lines from 10 cancer types. Tumor data were obtained from The Cancer Genome Atlas (TCGA) and cell line data from the Cancer Cell Line Encyclopedia (CCLE). The analyses are presented in the following publication: Schlicker, A. et al. OncoScape: Exploring the cancer aberration landscape by genomic data fusion. Sci. Rep. 6, 28103 (2016)
Publication
If you use OncoScape in a publication, please cite: Schlicker, A. et al. OncoScape: Exploring the cancer aberration landscape by genomic data fusion. Sci. Rep. 6, 28103 (2016).
Contacts
If you have any questions or suggestions regarding OncoScape, please contact Lodewyk Wessels (l.wessels@nki.nl).
Shiny WebApp v4
This shiny web app is developed & hosted by Research - IT department (r.rahman@nki.nl) at the Netherlands Cancer Institute - NKI.
License
Copyright © 2015 Netherlands Cancer Institute Licensed under the MIT License.

Select Cancer type
Select Score type
Select Cut-off Score
Select Sample type
Cancer-type-specific top candidate genes Download
Cancer-type-specific top candidate genes Download
Cancer-type-specific top candidate genes Download
Click to see table header descriptions!
Table column descriptions
- Genes: HUGO gene symbol
- OG Score: Oncogene score for the respective gene
- TS Score: Tumor suppressor score for the respective gene
- Combined Score: Combined score, calculated as oncogene score - tumor suppressor score, for the respective gene
- OG.Meth: Indicates if the gene shows oncogene-like DNA methylation changes
- OG.CNA: Indicates if the gene shows oncogene-like DNA copy number alterations
- OG.Mut: Indicates if the gene shows oncogene-like somatic mutation profiles
- OG.shRNA: Indicates if the gene shows oncogene-like changes after shRNA knock-down
- OG.Expr: Indicates if the gene shows oncogene-like gene expression changes
- TS.Meth: Indicates if the gene shows tumor suppressor-like DNA methylation changes
- TS.CNA: Indicates if the gene shows tumor suppressor-like DNA copy number alterations
- TS.Mut: Indicates if the gene shows tumor suppressor-like somatic mutation profiles
- TS.shRNA: Indicates if the gene shows tumor suppressor-like changes after shRNA knock-down
- TS.Expr: Indicates if the gene shows tumor suppressor-like gene expression changes
- Cancer: Cancer type showing the association
- External links: Link to the GeneCards entry for the respective gene
Gene Upload Method
Notice! Input file must be tab-separated with the first column having the HGNC gene symbols. Header line should also be provided.
Another thing!Once your file is uploaded, the meassage 'Upload complete' will be visible. Please then click the 'Refresh Results' button to generate plots and scores.
Select Score type
Select Sample type
User-selected genes across cancer-types Download
User-selected genes across cancer-types Download
Cancer-type-specific scores for user-selected genes Download
Select to view detail scores on scecific cancer type:
Click to see table header descriptions!
Table column descriptions
- Genes: HUGO gene symbol
- OG Score: Oncogene score for the respective gene
- TS Score: Tumor suppressor score for the respective gene
- Combined Score: Combined score, calculated as oncogene score - tumor suppressor score, for the respective gene
- OG.Meth: Indicates if the gene shows oncogene-like DNA methylation changes
- OG.CNA: Indicates if the gene shows oncogene-like DNA copy number alterations
- OG.Mut: Indicates if the gene shows oncogene-like somatic mutation profiles
- OG.shRNA: Indicates if the gene shows oncogene-like changes after shRNA knock-down
- OG.Expr: Indicates if the gene shows oncogene-like gene expression changes
- TS.Meth: Indicates if the gene shows tumor suppressor-like DNA methylation changes
- TS.CNA: Indicates if the gene shows tumor suppressor-like DNA copy number alterations
- TS.Mut: Indicates if the gene shows tumor suppressor-like somatic mutation profiles
- TS.shRNA: Indicates if the gene shows tumor suppressor-like changes after shRNA knock-down
- TS.Expr: Indicates if the gene shows tumor suppressor-like gene expression changes
- Cancer: Cancer type showing the association
- External links: Link to the GeneCards entry for the respective gene
The box plots show the log fold change of the gene expression (resp. copy number data) of the tumor and normal samples. Differences were assessed with a Wilcoxon test and p-values were corrected with the Benjamin-Hochberg procedure to control the false discovery rate (FDR). Differences are considered significant when the adjusted p-value is less than 0.05.
Gene Expression Download Plot
Copy Numbers Download Plot
Achilles Download Plot
Two-dimensional overview of the prioritization scores. Genes are plotted column-wise sorted according to chromosomal location, starting with the telomere of chromosome 1p in the upper left corner. Lines delineate the different chromosomes and numbers indicate chromosome names.
Result Plot Download Plot
The pathway diagrams are retrieved from KEGG using the pathview package. Each square represents a gene family and is coloured according to the maximal absolute value of the selected score (oncogene, tumor suppressor or combined) for genes in this family. In the overview with all cancer types, each cancer type is shown as a stripe in alphabetical order of the cancer type abbreviations. When you select a specific cancer type in the menu, you can see the scores of the tumours, the cell lines, or both at the same time (stripes with tumours on the left and cell lines on the right).
Pathway Plot Download Plot
Number of samples analyzed
The figure shows the number of cell lines, normal samples and tumor samples analyzed for each cancer type and data type. White dots indicate the number of matched normal samples available for DNA methylation (Meth) and copy number altersion (CNA).
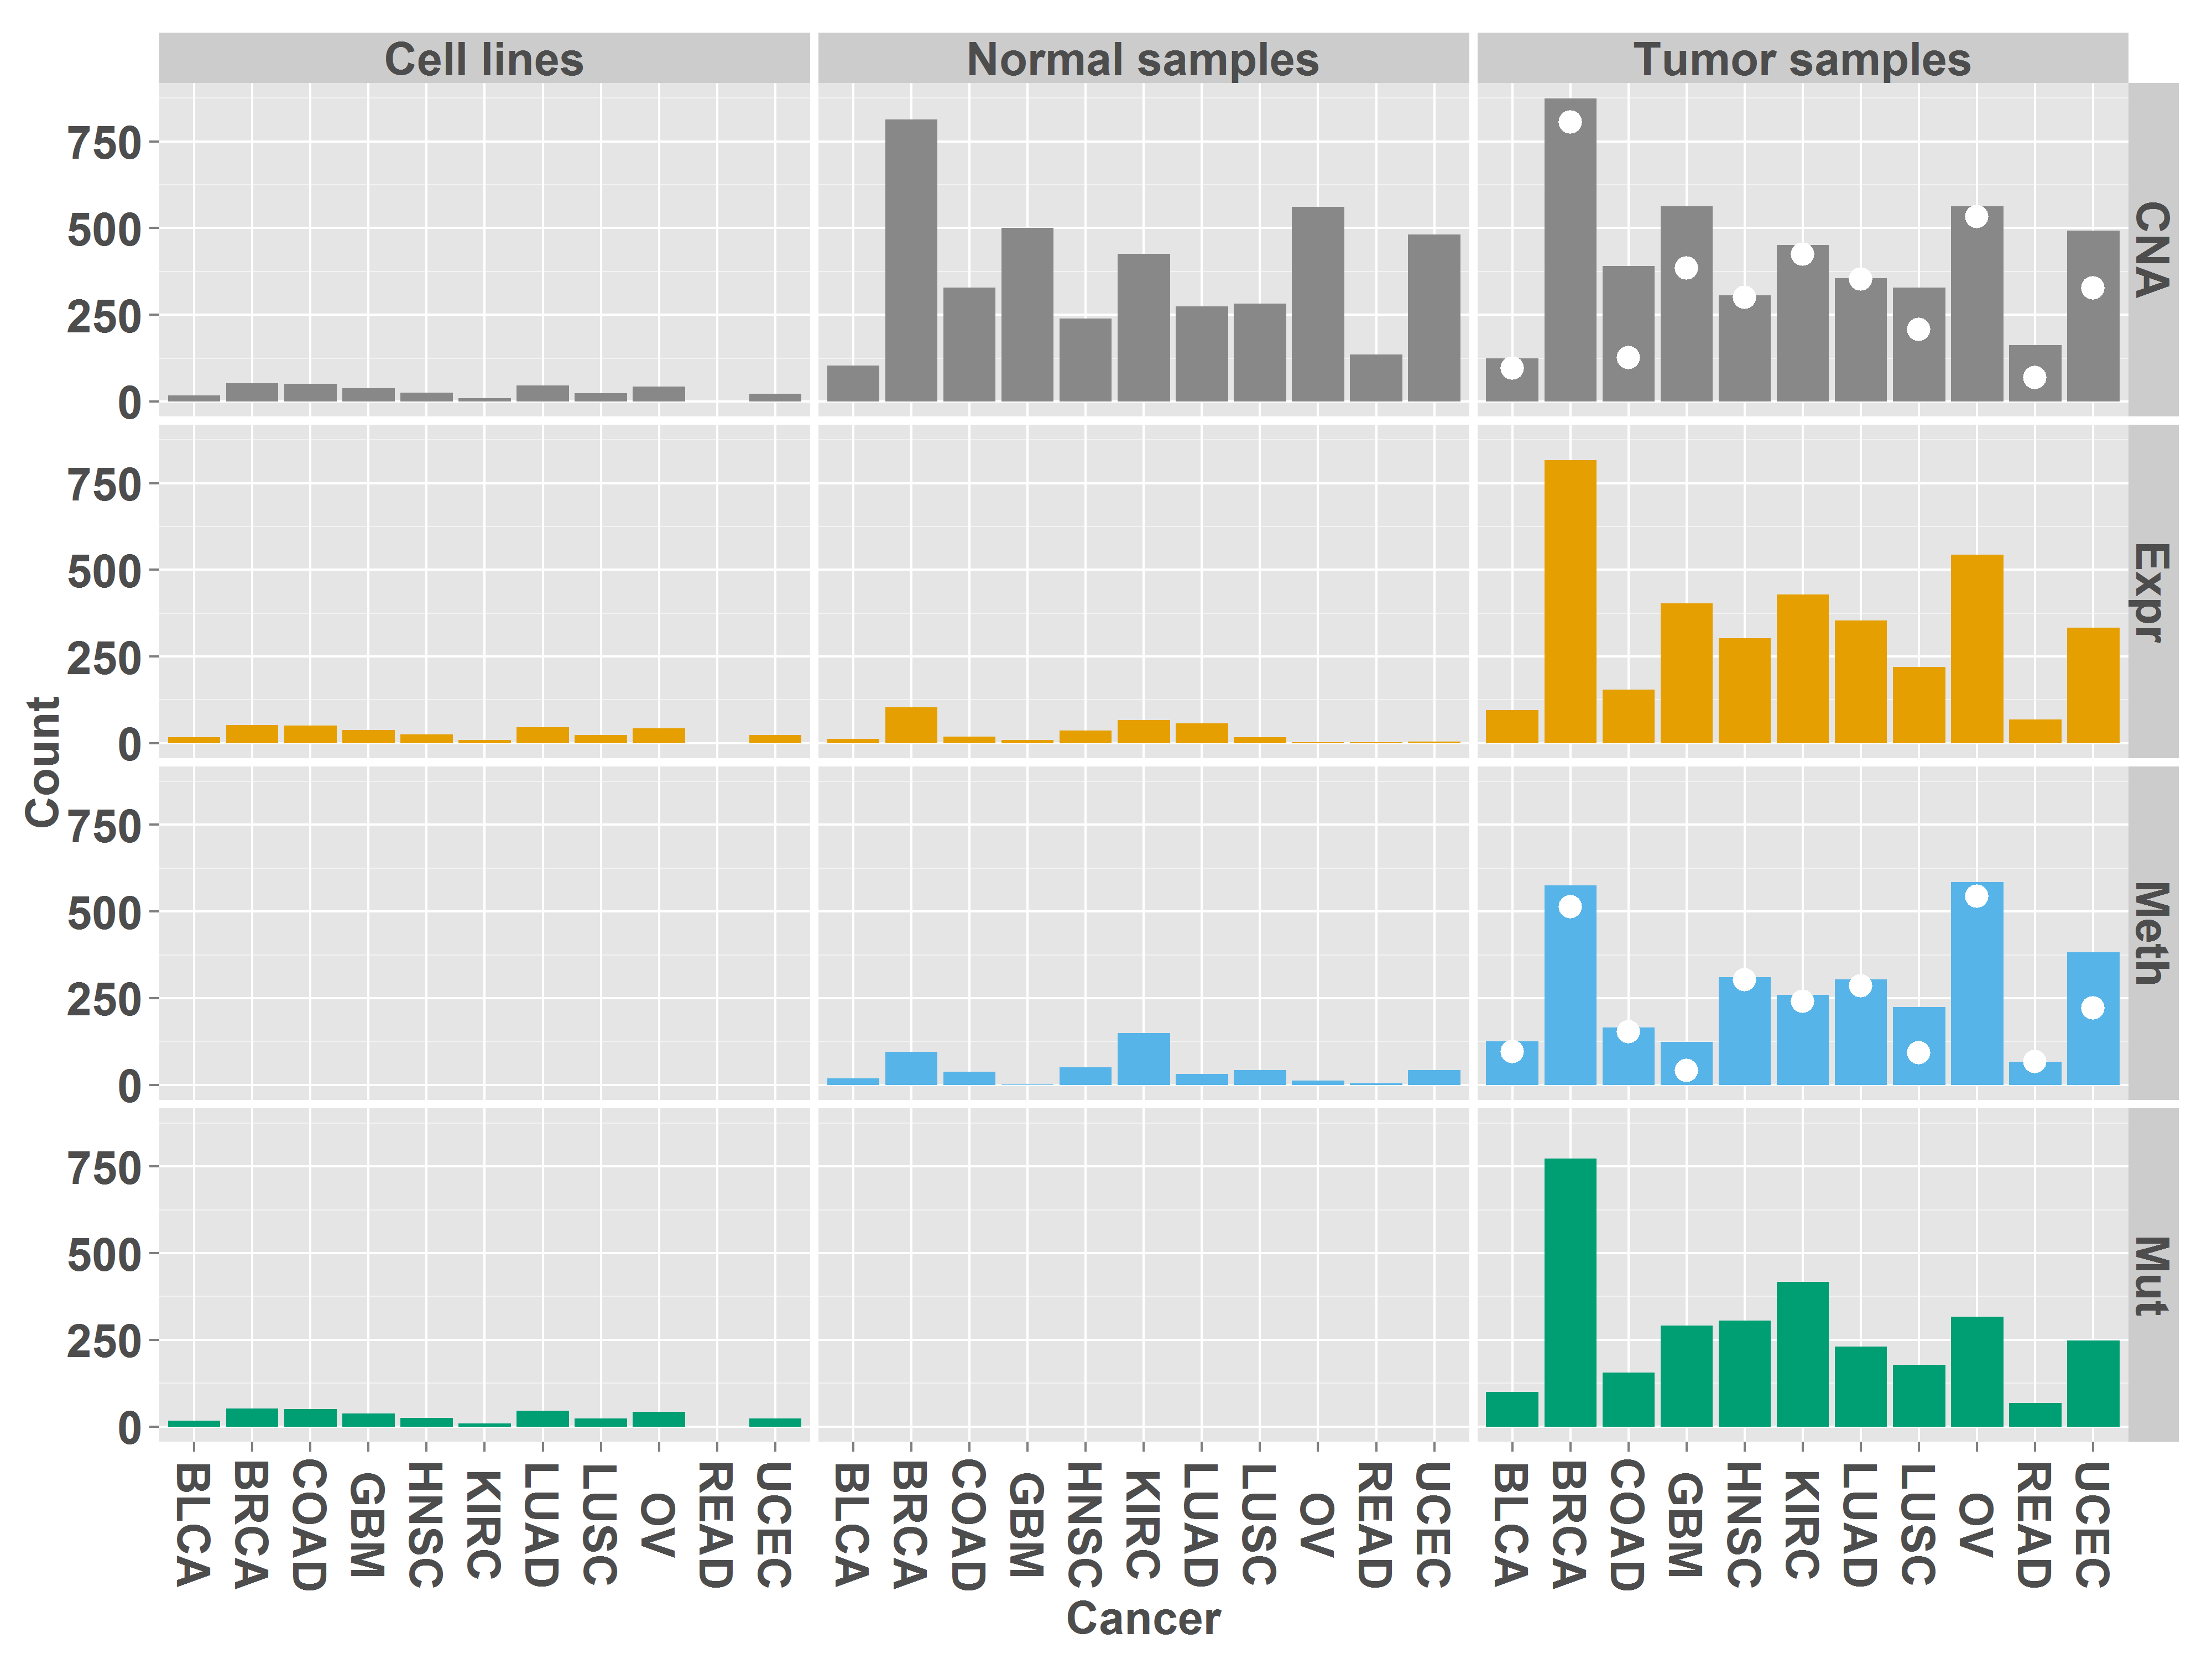
The exact numbers of samples are contained in the following table. Each row contains the number of samples available for the specified data type. Rows 5 and 6 contain the number of samples with available mRNA expression data and copy-number data or DNA methylation data, respectively. The last row contains the number of cell lines available in CCLE for each cancer type.
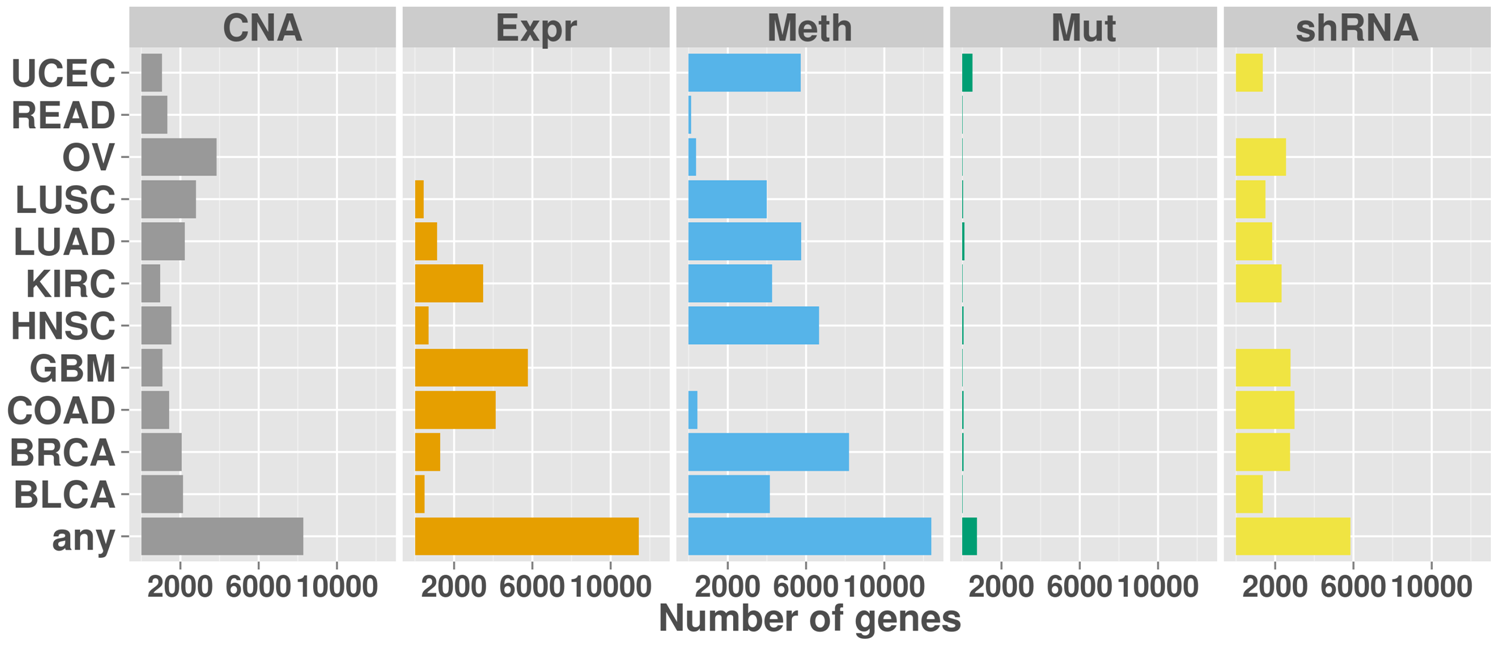
Oncogene alterations across cancers
Overview of the number of genes with activating aberrations for each cancer type and data type. The last row shows the number of genes with aberrations in any of the cancer types.
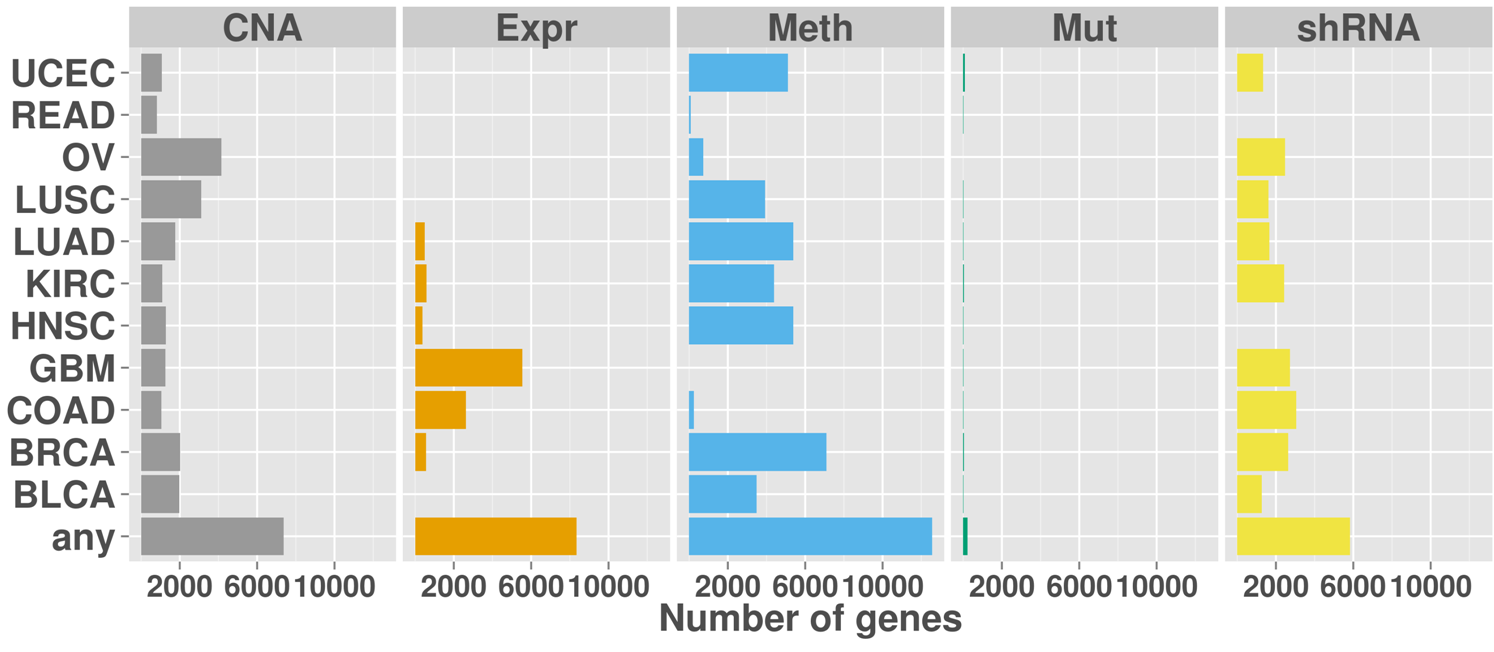
Tumor suppressor alterations across cancers
Overview of the number of genes with inactivating aberrations for each cancer type and data type. The last row shows the number of genes with aberrations in any of the cancer types.
Number of genes with score >= 1
Number of genes with respective scores greater or equal to 1. In case of the combined score (calculated as oncogene score (OG) - tumor suppressor gene score (TS)), the absolute value was taken into account.
Number of genes with score >= 2
Number of genes with respective scores greater or equal to 2. In case of the combined score (calculated as oncogene score (OG) - tumor suppressor gene score (TS)), the absolute value was taken into account.
Number of genes with score >= 3
Number of genes with respective scores greater or equal to 3. In case of the combined score (calculated as oncogene score (OG) - tumor suppressor gene score (TS)), the absolute value was taken into account.
Number of genes with score >= 4
Number of genes with respective scores greater or equal to 4. In case of the combined score (calculated as oncogene score (OG) - tumor suppressor gene score (TS)), the absolute value was taken into account.
Which cancer types were analyzed and what do the cancer codes mean?
- BLCA : Bladder Urothelial Carcinoma
- BRCA : Breast invasive carcinoma
- COAD : Colon adenocarcinoma
- GBM : Glioblastoma multiforme
- HNSC : Head and Neck squamous cell carcinoma
- KIRC : Kidney renal clear cell carcinoma
- LUAD : Lung adenocarcinoma
- LUSC : Lung squamous cell carcinoma
- OV : Ovarian serous cystadenocarcinoma
- READ : Rectum adenocarcinoma
- UCEC : Uterine Corpus Endometrial Carcinoma
How are the scores computed / what do the scores mean?
Tumor samples are compared with normal samples to identify differences. If a gene is found to be altered, this gene receives a score of 1 for this data type and else a score of 0. Details on the scoring for each data type are given below. Activating and inactivating alterations are both scored independently for each gene, and the sums of the activating and inactivating aberrations yielded an oncogene score and a tumor suppressor gene score, respectively. Additionally, we calculated the difference between oncogene score and tumor suppressor gene score, referred to as overall score, and the sum between oncogene and tumor suppressor scores, referred to as aberration score. Genes were then ranked based on one of these scores to be classified as potential new oncogene or tumor suppressor gene. Pathway alteration scores were calculated by averaging scores for all genes assigned to the same pathway. Aberrations in cancer cell lines were assessed by comparing the cell lines with normal samples available from TCGA using the same approach as for tumor samples.
How are gene expression aberrations scored?
Normalized gene expression data for tumor and normal samples, either from an Illumina sequencing platform or Agilent arrays depending on availability for each cancer type, was obtained from TCGA. We compared expression levels for each gene between tumors and matched normal samples using paired Wilcoxon tests and corrected nominal p-values using the Benjamini-Hochberg procedure. If a gene was significantly (FDR < 0.05) expressed (lower or higher) in tumor samples, it received a +1 towards tumor suppressor or oncogene score, respectively.
How are copy-number changes scored?
Segmented DNA copy-number data for tumor and normal samples were obtained using Affymetrix SNP6 arrays by TCGA. We compared log-ratio copy number values between tumor samples and matched normal samples using paired Wilcoxon tests and corrected p-values using Benjamini-Hochberg’s procedure. For genes with a significant difference in copy-number (FDR < 0.05), we calculated the Spearman correlation between copy-number and gene expression. A gene was scored as potential tumor suppressor or oncogene if 1) its copy-number value in tumor samples was significantly lower or higher than in normal samples and 2) the copy-number was significantly (FDR < 0.05) positively correlated with gene expression across the tumor samples.
How are DNA methylation changes scored?
We analyzed DNA methylation data in a probe-wiseuser fashion. For each probe, we compared methylation values in tumor and normal samples using unpaired Wilcoxon tests and corrected p-values using the Benjamini-Hochberg procedure. For each probe with a significant (FDR < 0.05) difference between methylation in tumor and normal samples, we computed the Spearman correlation between methylation level and expression of the genes annotated to that probe according to the Illumina annotation across all tumor samples. Correlations with FDR < 0.05 were regarded as significant. A gene was scored as tumor suppressor gene if 1) at least one associated methylation probe in the gene body exhibited significantly lower methylation in tumors and 2) the methylation was positively correlated with gene expression, or if at least one other associated methylation probe showed gain of methylation in tumors and gene expression was negatively correlated. In contrast, a gene was scored as oncogene if 1) at least one probe in the gene body showed gain of methylation and 2) was positively correlated with expression or any other associated probe exhibited lower methylation in tumors and methylation was negatively correlated with gene expression.
How are somatic mutations scores?
Mutations were scored according to the 20/20 rule published by Vogelstein and colleagues. We divided mutations according to their classification into oncogene mutations (missense mutations and in frame deletion/insertions) and tumor suppressor mutations (frame-shift deletions/insertions, nonsense mutations and splice site mutations). Then, we calculated an oncogene mutation rate (OGMR) and a tumor suppressor mutation rate (TSMR) for each gene. The OGMR was defined as one minus the number of distinct oncogene mutations divided by the total number of mutations. The TSMR was defined as distinct tumor suppressor mutations divided by the number of total mutations. Genes with an OGMR > 0.2 and TSMR < 0.05 were scored as oncogene. A gene was scored as tumor suppressor if its TSMR > 0.2 or if the OGMR > 0.2 and the TSMR > 0.05. We required a minimum of five oncogene or tumor suppressor mutations in order to score a gene as oncogene or tumor suppressor, respectively.
How are data from shRNA knock-down screens scored?
Project Achilles assessed cell viability after knocking down genes using different shRNA hairpins. In order to minimize off-target effects, Project Achilles integrated knock-down results of several hairpins targeting the same gene into so called "gene solutions", providing a cell viability score for each gene and cell line combination. We used only genes for which only a single gene solution was provided. For each gene, we derived a distribution of viability values across all cell lines. A gene was scored as potential oncogene for one cancer type if at least 25% of the cell lines for this cancer type had a knock-down viability score that was lower than the 25th percentile across all cell lines. If at least 25% of the cell lines had a knock-down viability score greater than the 75th percentile for that gene, it was scored as potential tumor suppressor gene.
What do the '-' indicate in the scores table?
The '-' in the scores table can indicate two things. If a row contains valid oncogene/tumor suppressor/combined score (e.g. 3,-1,0) but some other column is set to '-' then it indicates a missing value in the database for this column. On the other hand, if a data row is completely filled with '-' for the score columns then this specific gene is not found in the database.
Why user uploaded gene not shown in the plots?
If user uploads a gene which is not a valid HGNC/HUGO gene symbol, then it is not shown in the plots. However, the scores table will show a data row for this gene but all the scores column will be set to '-'. This incident can also occour if some user uploaded gene is not found in the database.
Why number of genes not same in table and plots in 'Top Candidate Genes' page?
According to user selection criteria, top candidate genes are selected and shown into plots and table. However, all the geens are shown in the table, but only top 1000 genes are shown in the plots.